View all questions & answers for the NSE 7 - Enterprise Firewall 7.6 Administrator Exam Materials exam
NSE 7 - Enterprise Firewall 7.6 Administrator Exam Materials-Question 35 Discussion
Comments
Selected Answers: B, C
Selected Answers: B, C
Selected Answers: B, C
//Security Fabric traffic log to UTM log correlation
In a Cooperative Security Fabric (CSF), the traffic log is generated by the ingress FortiGate, while UTM inspection (and subsequent logs) can occur on any of the FortiGates.
This feature adds extensions to traffic and UTM logs so that they can be correlated across different FortiGates within the same security fabric. It creates a UTM reference across CSF members and generates the missing UTM related log fields in the traffic logs as if the UTM was inspected on a single FortiGate.
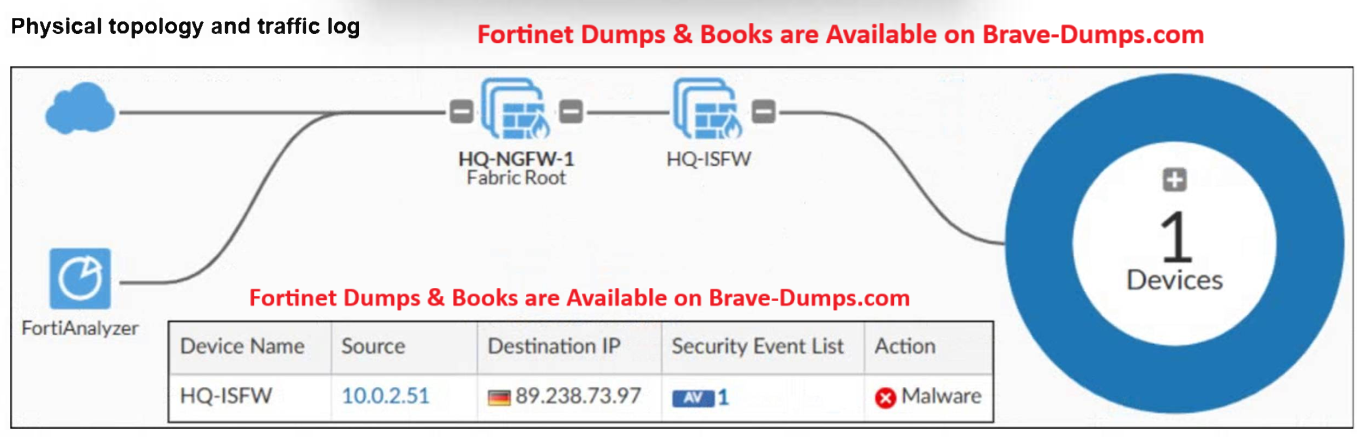
In the above reference, we can see a screenshot from FortiAnalyzer, where we have UTM event with "Device Name" set to first FortiGate in that traffic path, but in the log details, we see Source -> Device Name as the upstream FortiGate that did the UTM inspection, so both are consolidated in one log.
A physical topology along with a traffic log is shown. You are using FortiAnalyzer to monitor traffic from the device with IP address 10.0.2.51, which is located behind the FortiGate internal segmentation firewall (ISFW) device. Unified threat management (UTM) is not enabled in the firewall policy on the HQ-ISFW device, and you are surprised to see a log with the action Malware, as shown in the exhibit. What are two reasons why FortiAnalyzer would display this log? (Choose two answers)
Brave-Dump Clients Votes